When Joe Haumacher was hired as pitching coach for the Princeton baseball team prior to the 2023 season, the program was in dire straits. The Tigers were coming off a season in which they went 7–33, finishing in the basement of the Ivy League. They also finished last in the league in both 2019 and 2020, with the 2021 season shelved due to the COVID-19 pandemic. For Princeton, Haumacher represented the centerpiece of a shifting philosophy under longtime head coach Scott Bradley. The baseball team would ride the wave of analytics revolutionizing baseball across the major leagues.
“First, analytics can show us what’s happening,” Haumacher told The Daily Princetonian during a sit down interview. “Number two, show us what it means. What does it mean to throw a strike versus a ball? What does it mean to have on-base percentage versus slugging percentage, and which is more important? The third is to innovate. Show us what’s going on, tell us what it means, then innovate from there.”
For Haumacher, analytics can be boiled down to a simple concept — collecting data on baseball games, analyzing and searching for trends in said data, and using it to help players improve their in-game performance.
With Haumacher as pitching coach, the baseball team won 17 more games in 2023 than they did in 2022, finishing 24–23 and reaching the Ivy League Championship. Before coming to Princeton, he served as pitching coach at Amherst College and Dixie State University, winning awards and spearheading turnarounds that brought both pitching staffs to new heights during his respective tenures. After a few years, Haumacher received and accepted a job offer from the Baltimore Orioles in 2020.
Owners of the top-ranked farm system in baseball, the Orioles have a league-wide reputation as a leader in using analytics to develop successful major league players. While working across the Orioles’ minor league system as a pitching coach, he was entrusted with the development of some of MLB’s most promising future stars. When Princeton came calling after the 2022 MLB season, Haumacher decided it was time to return to the college game.
A New Movement
After arriving at Princeton, one of Haumacher’s first contacts was Adam Maloof. Maloof was a former college baseball player and current professor in Princeton’s geosciences department. Maloof has been a faculty fellow with the baseball team since 2013. He is a familiar face around the program and a self–described “baseball lifer.”
“Back then, we didn’t have much interest in analytics with the college program, so I just hung out with the team,” Maloof recounted.
“It wasn’t until Joe arrived, who had experience with analytics with the Orioles, that he said ‘we have to have an analytics team.’”
Maloof and Haumacher hit the ground running, placing advertisements around campus in search of student leaders who were interested in data analysis and willing to help the team. Haumacher had set up a similar group at Amherst, and his and Maloof’s experience coupled with student excitement created a program that rapidly snowballed. Maloof’s class Sabermetrics: An Analytical Approach to College Baseball, co-taught with Haumacher, received immediate interest last spring.

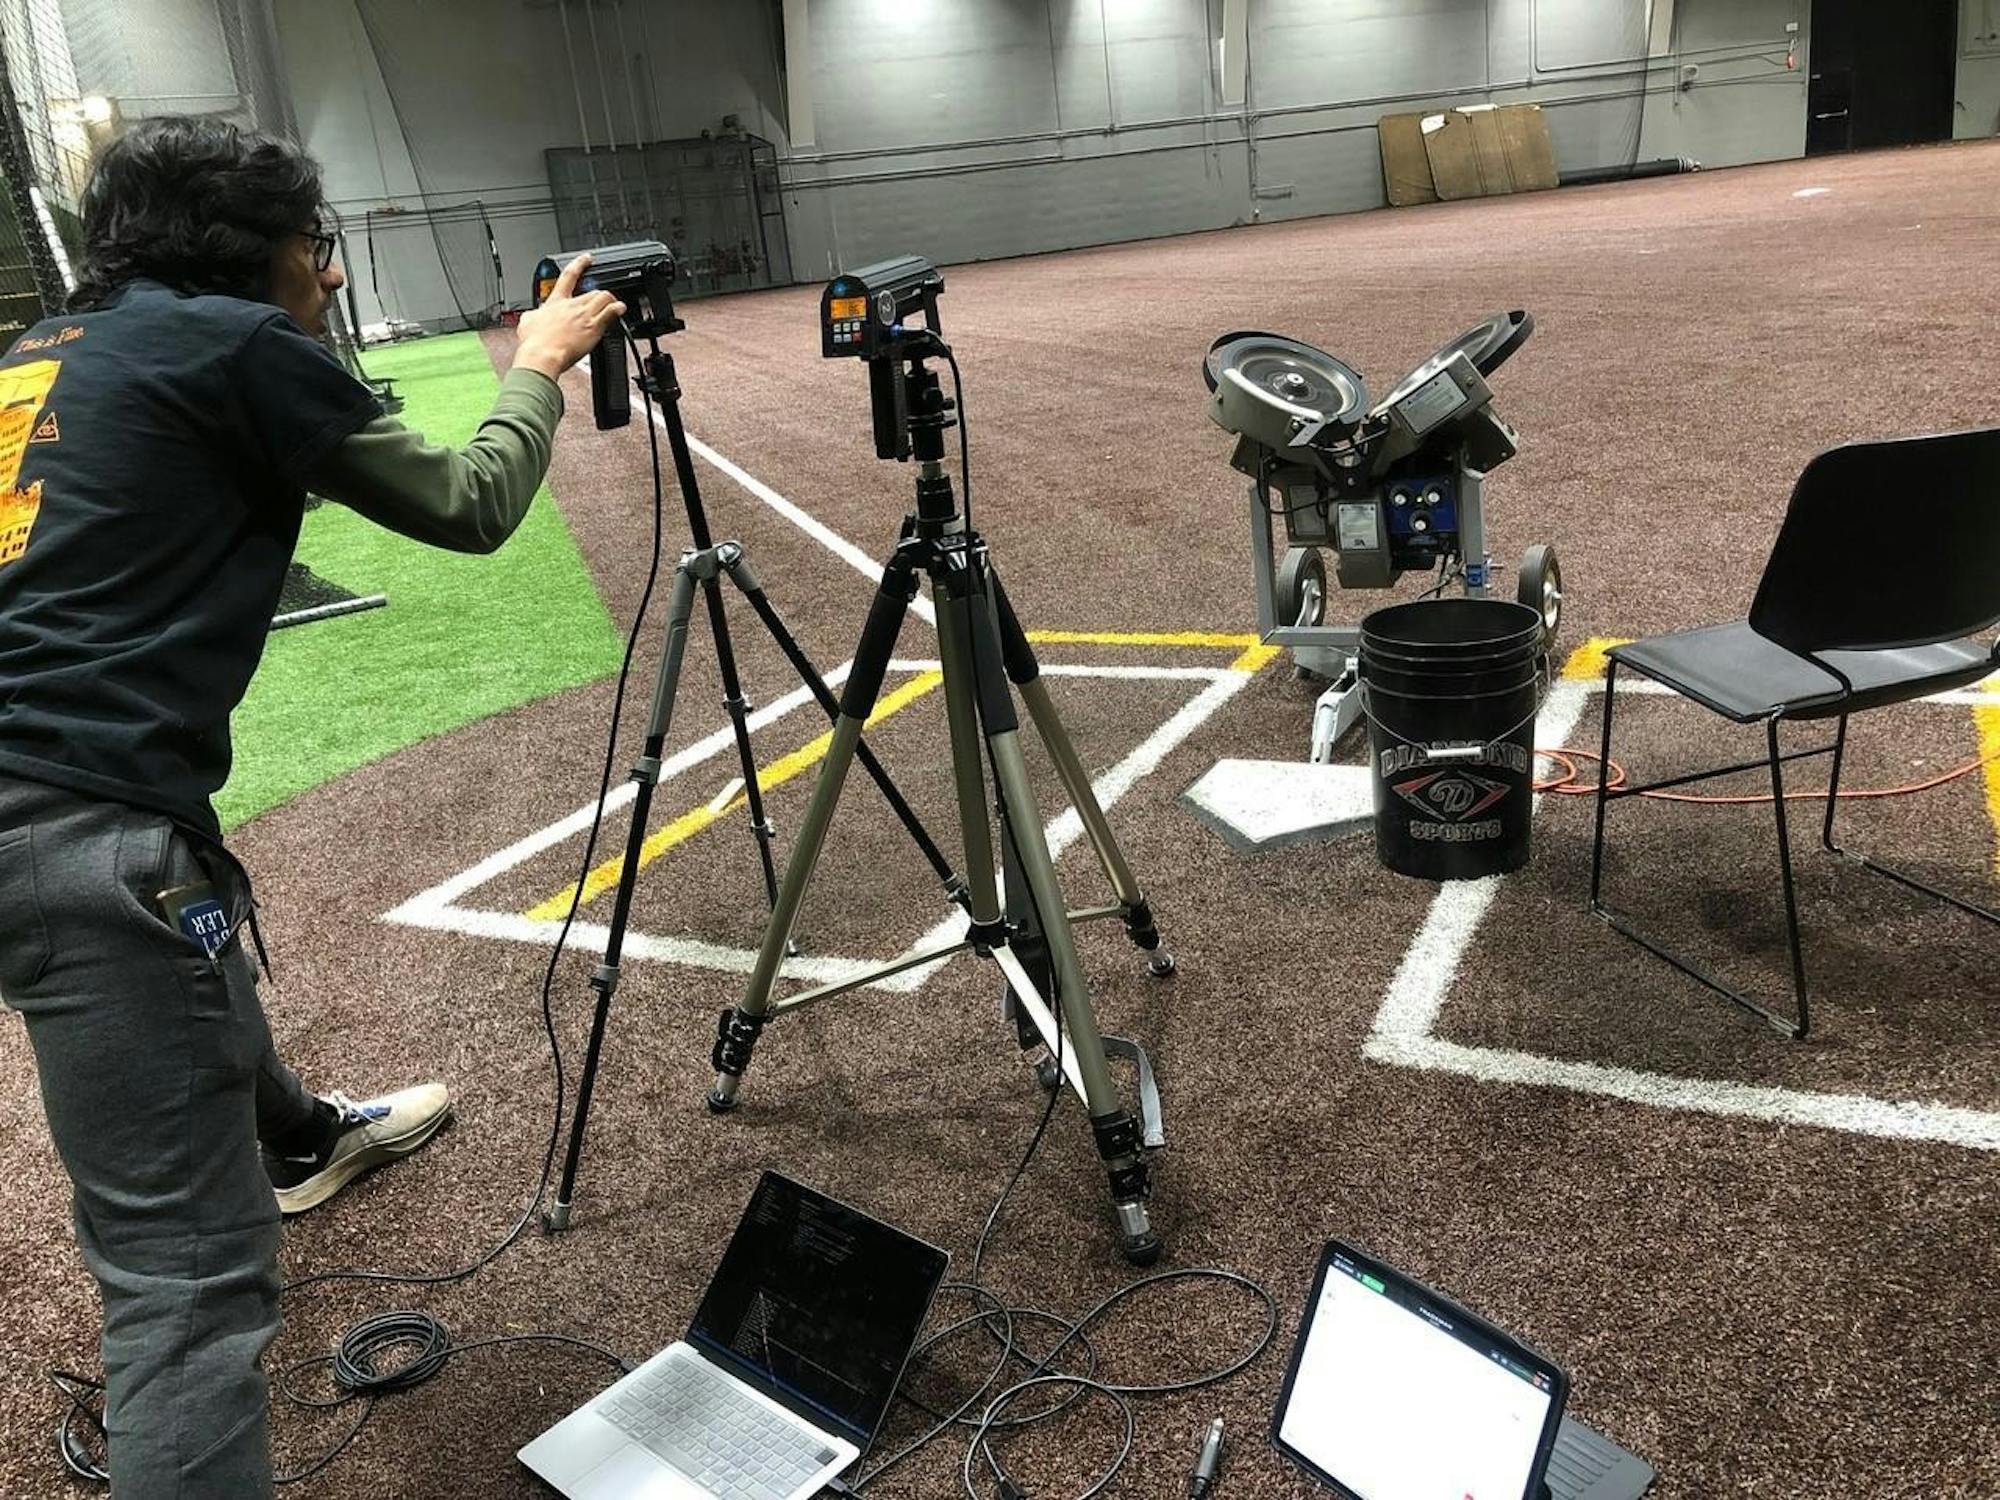
Students work with radar guns and pitching machines in Professor Adam Maloof’s analytics seminar.
Courtesy of Princeton’s Council on Science and Technology
Senne Michielssen ’25 — a computer science major and the president of the Princeton Baseball Analytics Club — was one of the first students to respond to Haumacher and Maloof’s ads. With the help of Michielssen, Alex Dreger ’25, and a few other students, Haumacher and Maloof successfully created a groundswell of analytics interest. The next step? Finding a way to collect the data crucial to analytics.

Gathering Data
One of their first steps together was looking into Trackman, a powerful system that uses Doppler radar to track the flight of a ball and can be found powering data collection efforts at MLB stadiums and in practice facilities across the league. Due to the fact that the Trackman system is still a rarity at the college level, Haumacher and Maloof saw the opportunity to gain an edge and pounced immediately.
Once the acquisition process reached its final stages, Haumacher dipped into a well of experience and major-league connections to fast-track its use before the 2023 season. “We had people from the Orioles come and train our guys on how to set the Trackman up and how to use it,” Haumacher explained. The Trackman was set up just days before the Tigers’ 2023 home opener against Dartmouth and has been collecting data ever since.
With the Trackman fully operational, the baseball and analytics teams gained access to a flood of data pulled from every single scrimmage, game or even practice for which the machine is used. “There’s something like 80 or 90 variables that it’s tracking,” Maloof added. Maloof later helped convert Trackman data into an easily digestible spreadsheet.
Data Analysis
The next step in the process was analyzing the data pulled.
“We’re generating a massive amount of information, and probably 90 [percent] of it just isn’t useful,” Maloof explained.
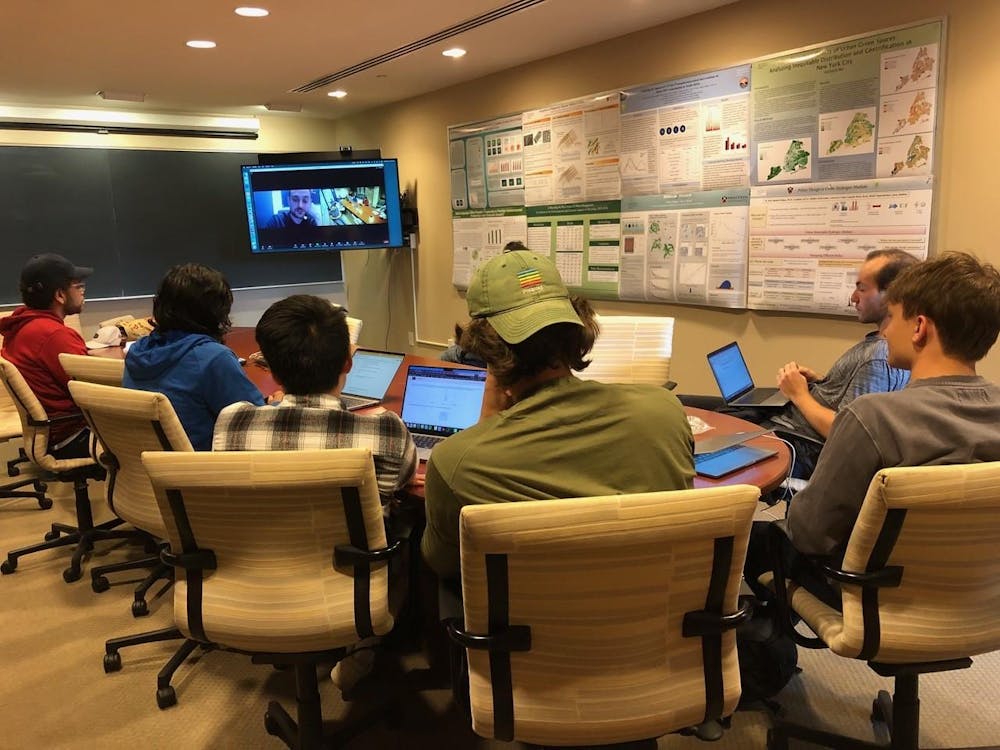
The baseball analytics team meets every Thursday on the C level of Jadwin Gymnasium. At these meetings, a group of around 15 members, drawn from a variety of majors but each interested in baseball and data in their own way, discuss ways in which they can aid the baseball team using data collected from Trackman and other sources. With the season rapidly approaching, this usually means scouting reports.
“When we’re preparing for the season, we’re really trying to make sure the scouting reports are ready to go,” Michielssen explained. “Our goal is to produce reports that the coaches can use in the dugout that have information about our players and the opposing players.”
These reports usually involve details on opposing pitchers’ tendencies, information about which pitches to throw to which hitters, and other information that can be immediately useful to the Tigers and their on-field efforts.
Just as notable as the scouting reports — and perhaps more exciting for the analytics team — are the long-term projects that each member of the team works on throughout the semester. Projects can range from app development to research papers, with each designed to address a specific facet of the game. Much of Maloof’s seminar was designed around project development, and each member of the analytics team has a story to tell about their own project.
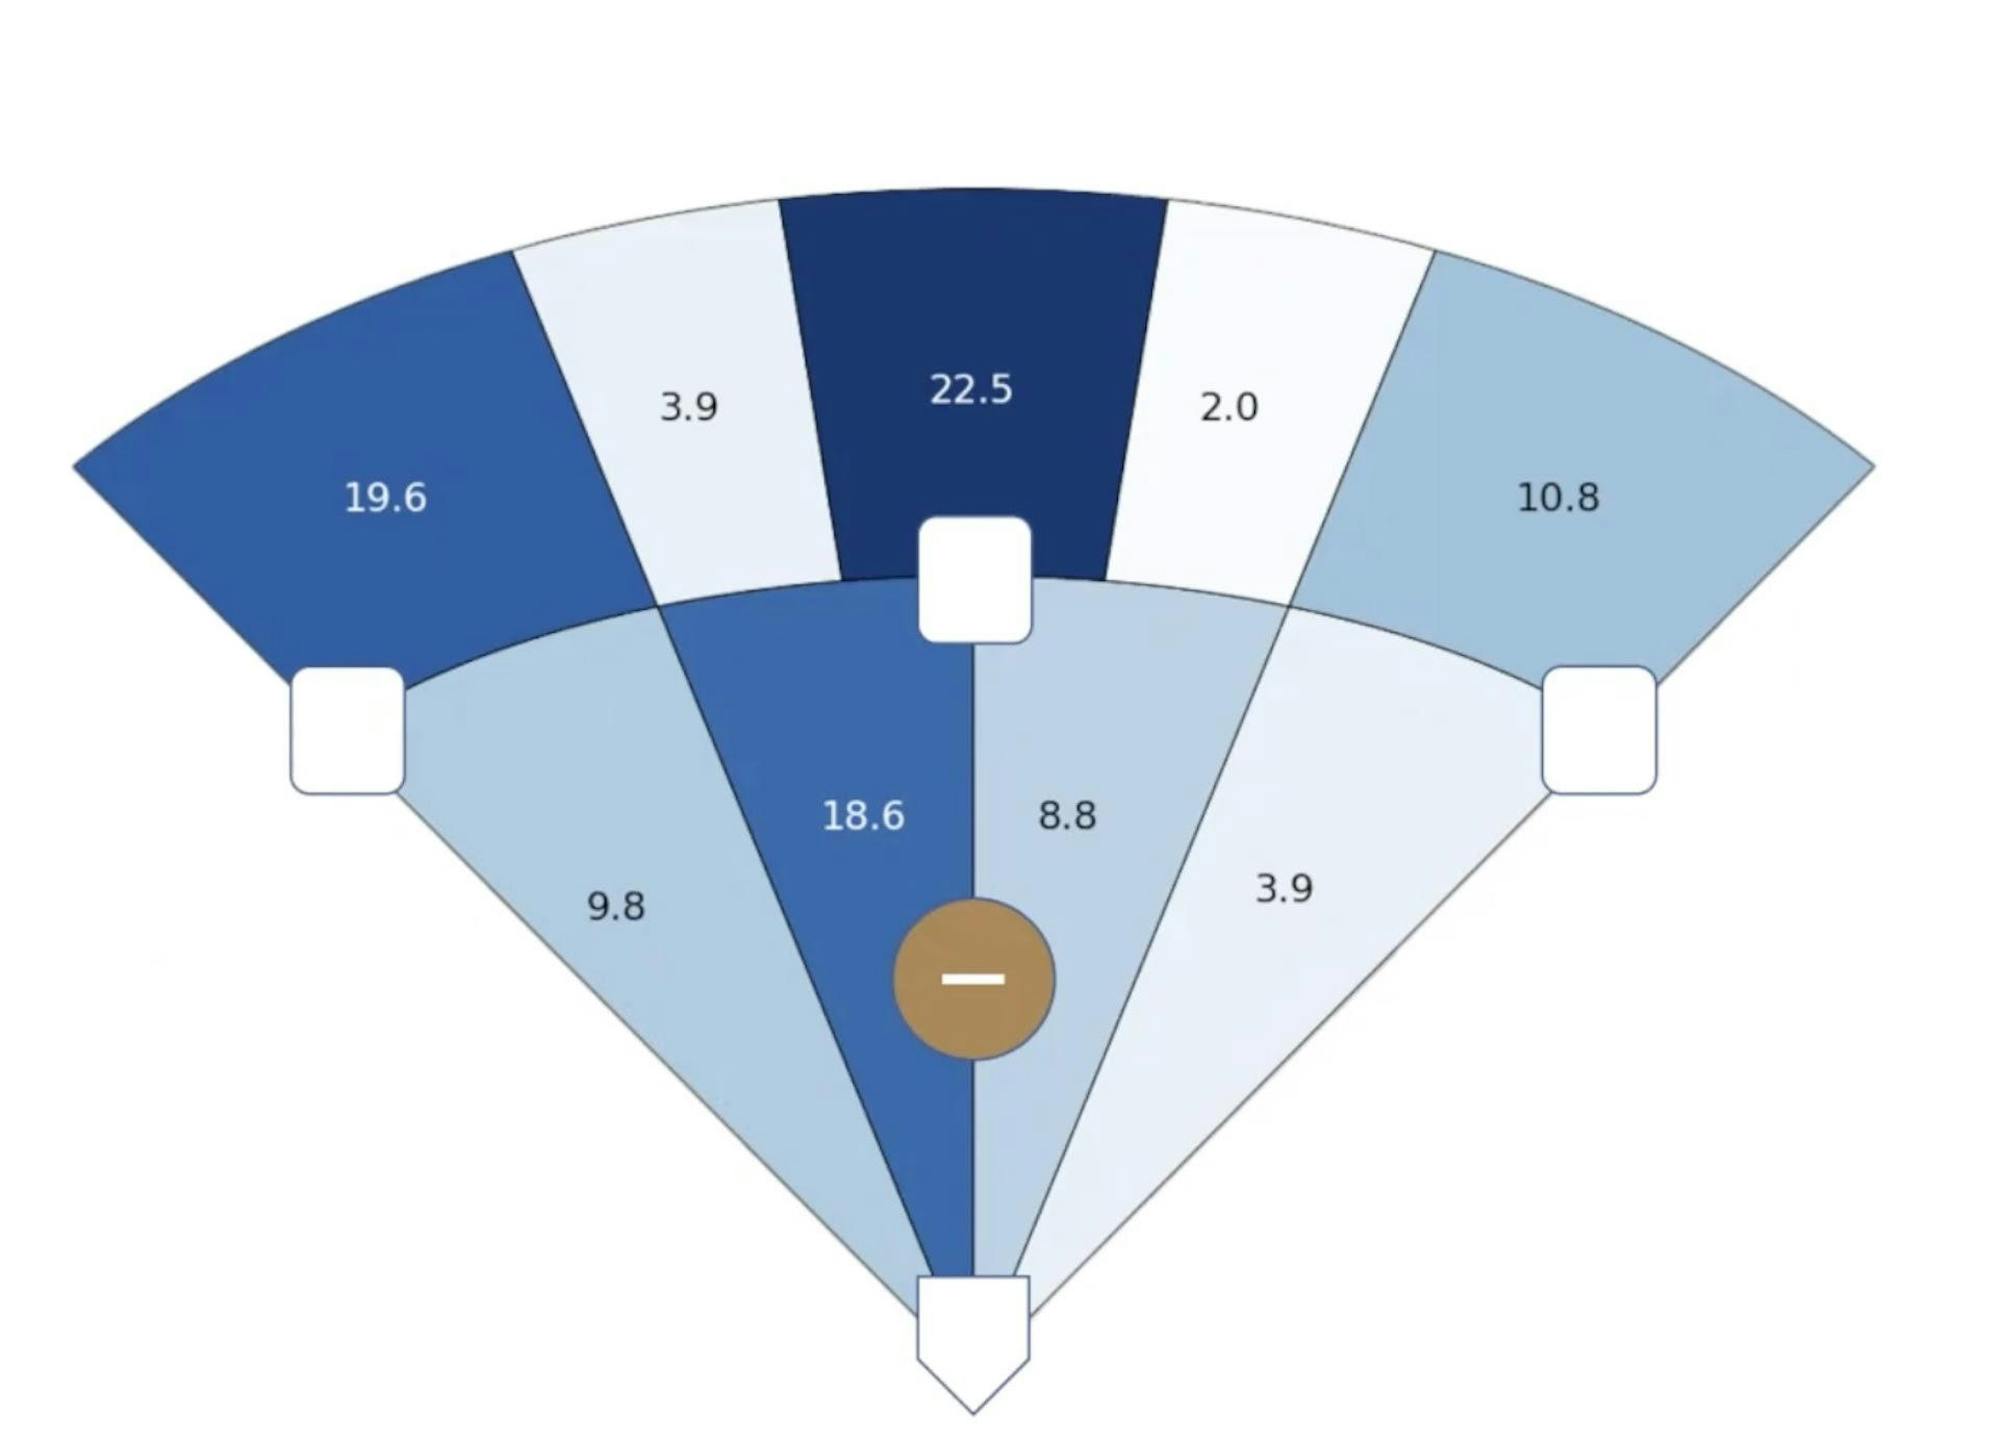
“The biggest project I worked on involved making spray charts,” Michielssen explained. “Whenever there’s a batted ball, we want to be able to plot wherever that batted ball lands, so we can understand hitters’ tendencies.”

For his project, Michielssen used a large language model to turn play-by-play descriptions into spray charts.
Courtesy of Senne Michielssen
This data can help teams in a variety of ways, as a team trying to defend a batter who hits the ball to left field 80 percent of the time will shift their defense towards left field. Michielssen’s biggest challenge was finding a way to convert written data into numerical data points.
“We were trying to make these spreadsheets, but we were struggling because we didn’t have the right data,” Michielssen elaborated. The NCAA website gives verbal descriptions of each event during a baseball game, but not numerical information on where balls are hit.
“We used large language models to turn that textual data into numerical data, allowing us to make spray charts.” This project can have massive implications for players, granting them access to a wealth of data that would otherwise take hours to comb over.
In conversation, Michielssen stressed the point that anyone, regardless of experience level, can join the analytics team. He explained how plenty of members have never worked with data, and instead focus on hands-on testing of pitching machines or radar guns to optimize their performance.
“Analytics doesn't just need to be for super nerdy math people, right?” he explained. “There’s something in baseball analytics for everyone, and everyone can find a project that they’ll find interesting.”
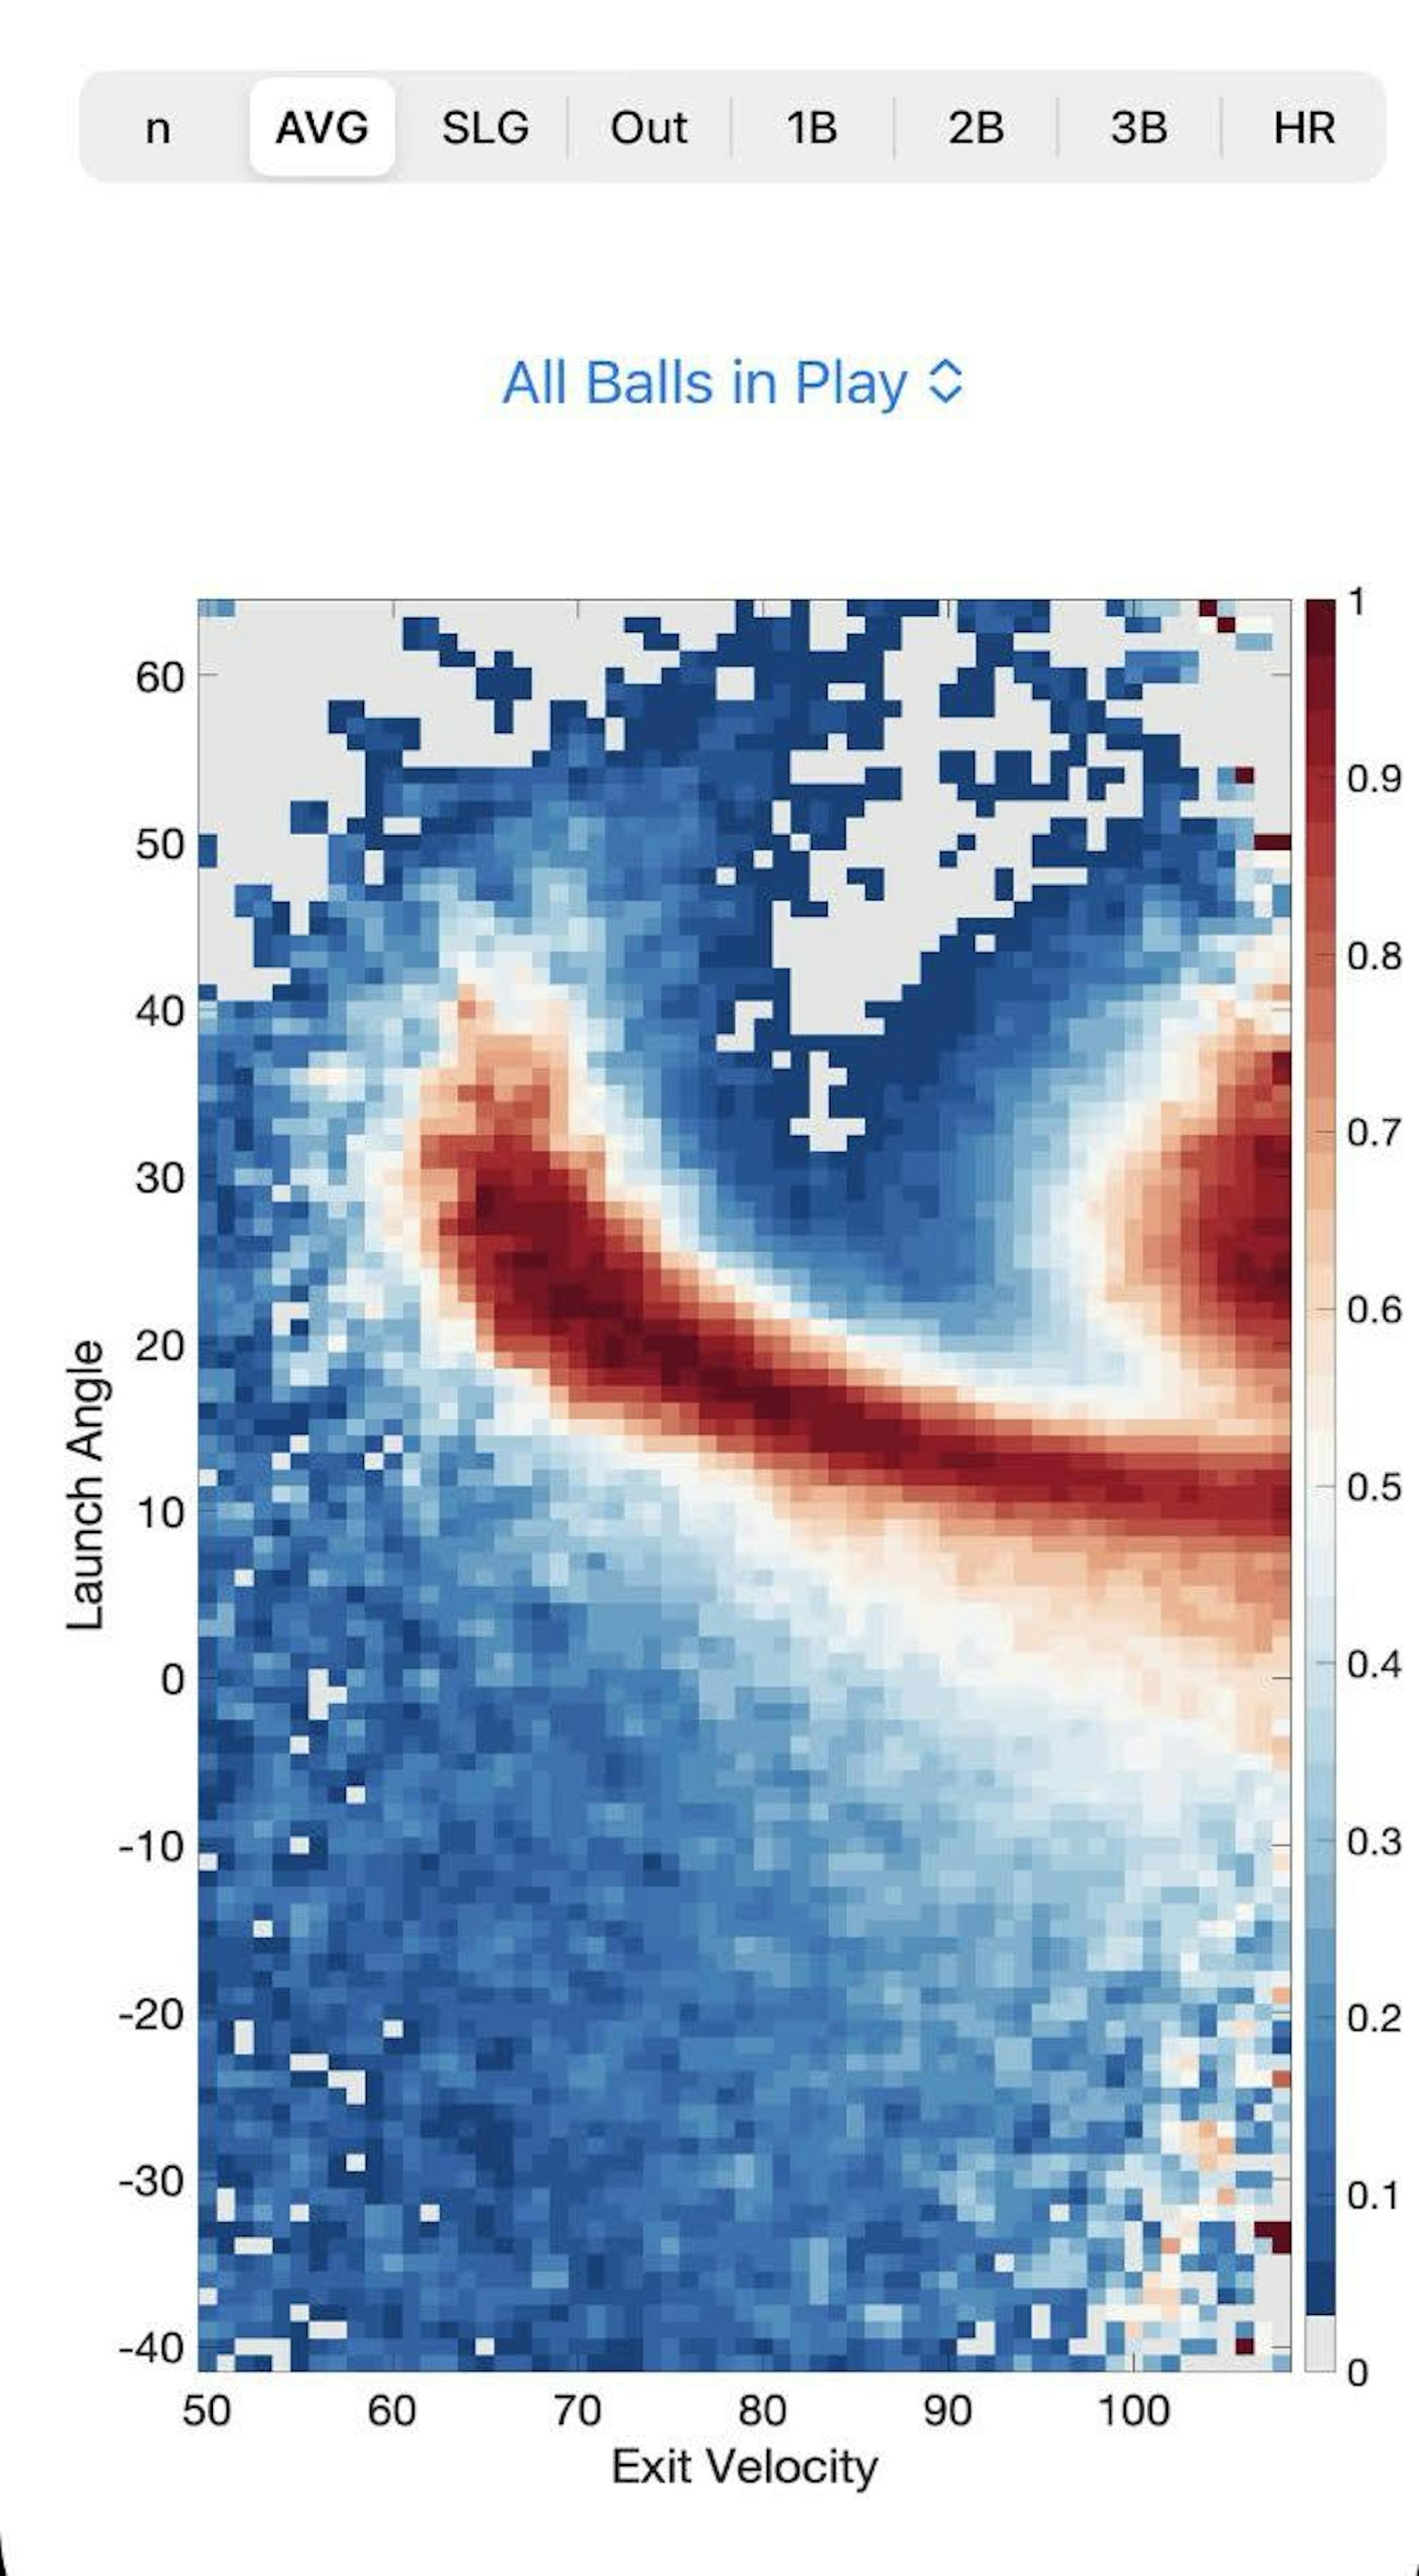
When Maloof sat down with the ‘Prince,’ he pulled out his iPhone and flipped through a series of apps until he found what he was looking for. He opened up an app, and a heat map of different batted ball speeds and launch angles appeared on the screen.
“This one is called ‘Hit or Not,’ and it’s for when the players are practicing inside,” Maloof added. “When you play inside, you want to take it seriously, but when you hit the ball into a net, you don’t know where it goes. This app takes exit velocity and launch angle data from the Trackman, and then you can predict what type of hit it was.”
Maloof developed this app himself, and anyone can find it on the App Store listed under his name. Players now use Maloof’s app at every practice and scrimmage.

Maloof’s Hit or Not app shows combinations of exit velocities (x-axis) and launch angles (y-axis) that lead to hits (red) or outs (blue).
Courtesy of Adam Maloof
With so much movement on the data analysis front, Haumacher, Bradley, and the rest of the coaching staff now have access to a wealth of information to help improve their players’ performance.
Analyst-Player Communication
Once the analytics team analyzes available data and creates scouting reports and projects, the ball returns to the coaches’ court where they decide how much information to give the players without overwhelming them.
“We just want to give the coaches the tools to make the players as best as they can be,” Michielssen explained.
Many of Haumacher’s beliefs on pitcher development heavily involve analytics, but some wouldn’t sound out of place coming from more traditional managers. He preaches location to his pitchers, noting that the first step to success is being able to throw strikes consistently.
Scouting reports are crucial to the analyst-coach-player communication pipeline, but are far from the only trick Haumacher has up his sleeve. One of his most important techniques, he explained, involves placing his pitchers in situations where they can be directly exposed to the data behind the reports. He has his pitchers work with the Trackman directly on days when they’re not pitching them, giving them a window into the information that the analytics team collects.
The Road Ahead
Though the trees around the boathouse are still bare, and students still shuffle between classes in their puffer jackets under gray February skies, spring is rapidly approaching for the Princeton baseball team. With a whole season ahead, there exists reason for boundless optimism around every part of the Princeton baseball team. Haumacher pointed to analytics on the other side of the ball, led by hitting coach Kyle Bonicki, as yet another reason for hope.
“All of the sudden it’s become this big community,” he said. “I think that the next two years, Princeton baseball fans, kids in the program are gonna be pretty surprised about what we can pull off.”
He continued, expressing hope that last year’s 17-game turnaround was just the first step in a process that will transform the Tigers into a perennial contender.
“The payoff hasn’t quite been realized yet to the point where it’s a ‘holy s**t’ moment yet, but I think it’s coming.”
The upcoming season will undoubtedly be a difficult one. The team will spend almost all of March on the road, traversing North Carolina, Virginia, and Maryland. This stretch of out-of-conference road contests has traditionally plagued the Tigers, who often limp into Ivy League play well under .500.
This year, Haumacher believes, will be different.
“As far as I’m concerned, there’s not many other programs that are like this,” he said. “I just keep telling our recruits and our coaches — it’s a special time at a special place.”
Joe Uglialoro is a staff writer for the Sports section at the ‘Prince.’
Please direct any corrections requests to corrections[at]dailyprincetonian.com.


