Howard Greene was finishing his graduate work at Harvard in 1963 when he received a call from a dean. Sweeping social changes were underway in the ’60s, he was told. Princeton was looking for a couple of young guys to come in and change its culture.
Greene didn’t have any connections to Old Nassau, as he had attended two of its Ivy League rivals. But he applied for a job in its admissions office anyways. Barely out of graduate school, the new director who hired him, Alden Dunham ’53, resolved to diversify Princeton’s mostly white and wealthy all-male applicant pool.
“It was the beginning of the edge of what was going to be an exciting time of change,” Greene recalled. He helped implement Dunham’s overhauled admissions system and put the University on the road to becoming a national academic powerhouse.
Previously confidential reports, statistics compiled from various publications, and more than a half dozen former employees told the story of how admissions increased access and outreach. While it’s important to celebrate Princeton’s accomplishments in diversifying its student body, recent data shows that there’s still much room for improvement. As was the case 60 years ago, it may be time to rethink the admissions system again.
A new way of doing things
Before World War II, the applicant pool was small and self-selecting, so the Office of Admission merely had to see if a young man met a set of minimum requirements for entrance. As soldiers returned home in 1946 — ready to attend college with their G.I. Bill benefits — the number of applications spiked.
Princeton’s gatekeepers increasingly had to decide who was most qualified to attend. The old selection process under the leadership of C. William Edwards ’36 focused on SAT scores, schoolwork grades, teachers’ recommendations, and an interview with an alumnus or admissions officer.
The Baby Boomers — the largest generation in American history — were reaching adulthood by the mid-1960s. They started applying to higher education at record levels. Suddenly, colleges had far more outstanding applicants than they could ever hope to admit. Princeton needed a new admissions system that could handle this demographic surge.
Dunham created what became the foundation of the University’s modern selection process. Admissions officers scored applications on a scale of one to five for their academic and extracurricular merits. Greene said that the few people who received two ones “clearly” would be admitted. Those with a one-two or two-one were likely to be admitted, and anyone with a three was “up for grabs” if they had something “special about their background.” This method favored building a well-rounded class — of narrowly-focused individuals — instead of taking well-rounded students. Someone who spent his time excelling in, say, the sciences or history was preferred over someone who earned C’s while taking a wide range of subjects.
Applicants who had certain identities or skills were placed into special categories: athletes, legacies, artists, minorities, and prospective engineering, architecture, and Woodrow Wilson School majors. Admissions officers then picked students from each group and tried to admit enough to meet their targets.
“If [only] you could have heard the battles in the discussions that would go on,” Greene said. “The idea was each of us were really to be advocates for that group of students we had interviewed and reviewed.”
By the time Dunham left Princeton in 1966 and Greene in 1969, the effects of their new process were already visible. The number of Black admits had tripled. Legacies dropped by more than 10 percentage points. Admits from rural areas were up too. The average SAT math score rose 21 points from the Class of 1965 to the Class of 1967. “Princeton Charlies” — the handsome, sociable guys who squeaked by with C’s — were increasingly replaced with academic superstars.

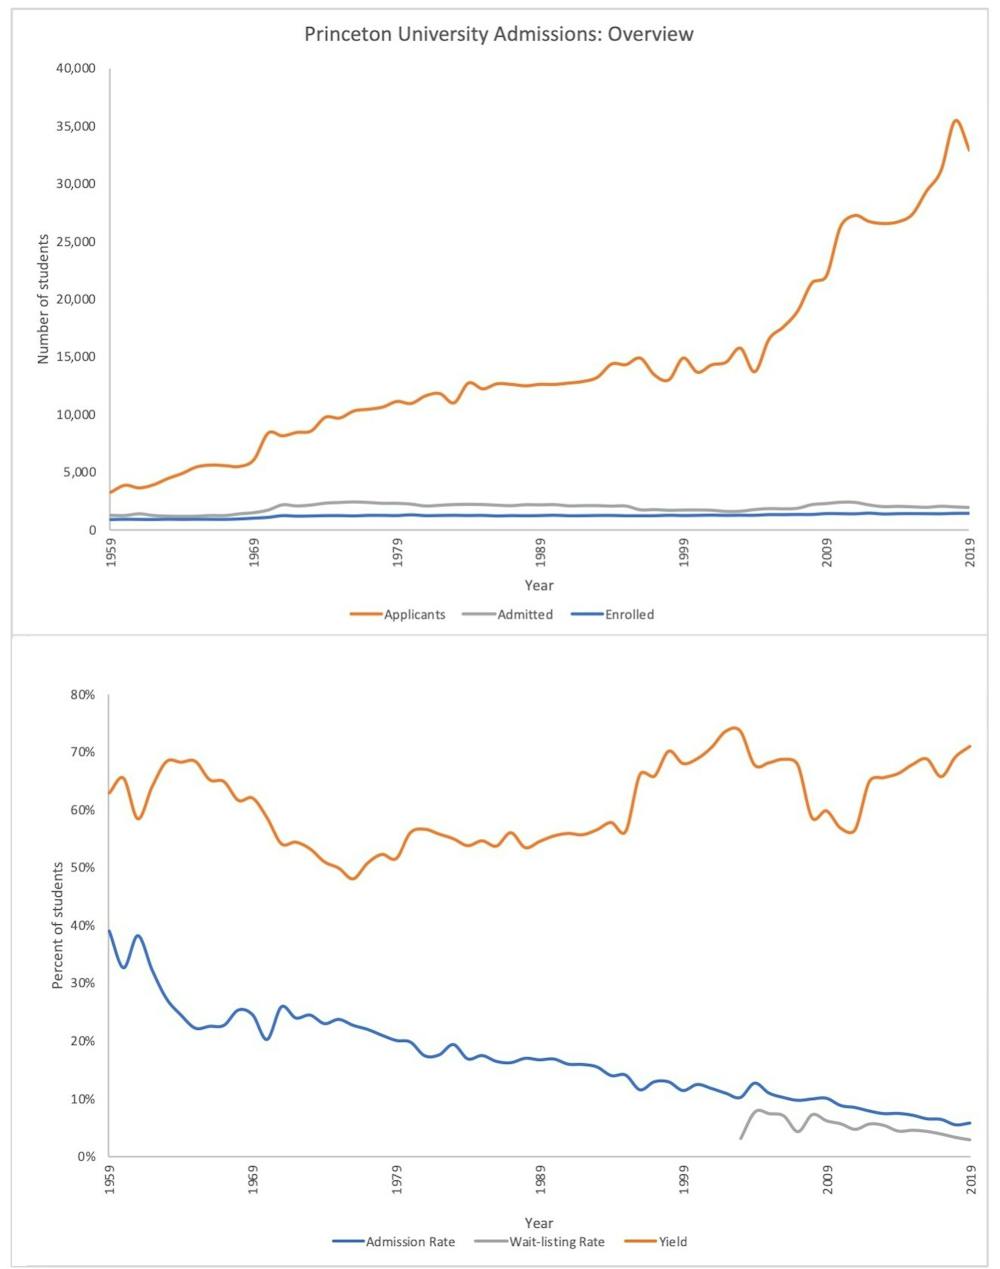
Top: The number of applications to Princeton have exploded over the past 60 years while increases in the student body's size have been modest in comparison. Bottom: The admission rate has dropped substantially since 1959. The yield — after climbing in the late 1960s — experienced a long-term decline until it reached all-time highs for the modern era in the early 2000s. Eliminating early admissions caused it to dip briefly in the early 2010s until the policy was reversed. Today, the yield is about as high as it has ever been. (Sources: “A Princeton Profile,” Common Data Sets, Princeton Alumni Weekly, The Daily Princetonian, compiled admissions reports)
Liam O’Connor / The Daily Princetonian
But the new system, with its categories, sowed division in the student body at the same time. A study of “Princeton Sons” conducted in 1970 reported that legacies were admitted on lower credentials, mostly attended private high schools, academically performed worse than non-legacies, and participated less in extracurricular activities.
Black students still faced an uneven playing field. Whereas the grade point average (GPA) for the entire Class of 1968 was 2.81 — on a scale of 7 in which 1.0 corresponds to a 4.0 GPA today — that of Black students was 3.59. Graduates of 11 elite private schools continued to be admitted at a rate twice as high as public school graduates. The idea of cobbling together a cohesive undergraduate class may have been more illusion than reality.
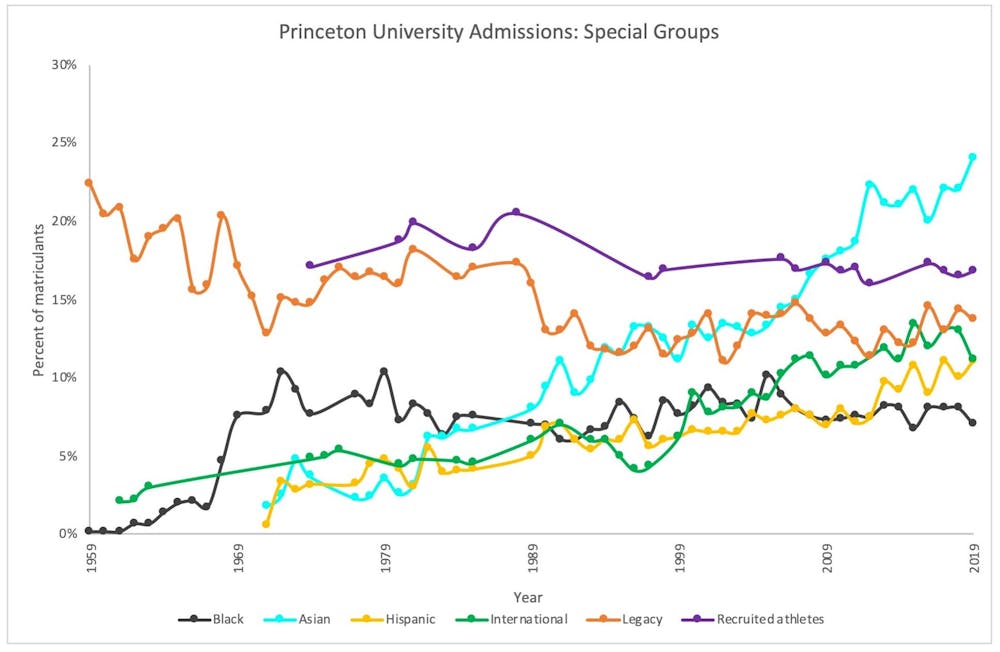
The representation of Asian, Hispanic, and international students has increased in the student body since the mid-twentieth century. After a spike in the late 1960s, growth in Black representation has stagnated. Legacies and athletes have remained mostly unchanged. (Sources: “A Princeton Profile,” Common Data Sets, Princeton Alumni Weekly, The Daily Princetonian, Princeton University “Admission Statistics,” compiled admissions reports)
Liam O’Connor / The Daily Princetonian
Coeducation arrives
At the end of his 1969 Alumni Day address, President Robert Goheen ’40 GS ’48 made the case to the “Princeton family” seated before him for the University to start admitting women. He spoke about gaining new perspectives, improving the quality of campus life, and preparing male students for a future in which women would join the workforce.
“Like any family we may have our disagreements, and like any family we find some kinds of change hard to take,” he said. But — behind this lofty rhetoric — more pragmatic concerns were driving Princeton’s march toward coeducation. Research had shown that top students were turning down Princeton to attend other colleges, such as Harvard, because they wanted to learn alongside women.
“You can imagine how the trustees and alumni association reacted when they learned of this: ‘How the hell can we let that happen?’” Greene said. Following two years of deliberations, Princeton admitted its first four-year female students into the Class of 1973. These pioneering women were smarter than their male classmates. Eighty-two percent of them ranked in the top 10th of their high school classes, against 75 percent of men. Their SAT verbal test scores were 46 points higher.
“They weren’t treated as a special group, and in a funny way you just went through the admissions process, and the strong women candidates emerged pretty naturally,” said John Friedman ’68, who became an admissions officer in time to select the second class of women. When he toured the country to encourage students to apply to Princeton, he went to dinners with local alumni, some of whom were opposed to coeducation.
“There were groups of alumni who just hated it,” he said. After dinner however, while talking to these “old curmudgeons” at the bar, they often told him that they hoped their granddaughters would one day get into Princeton.
By 1971, Princeton Alumni Weekly reported that the gender ratio in the freshman class had finally reached “civilized” proportions.
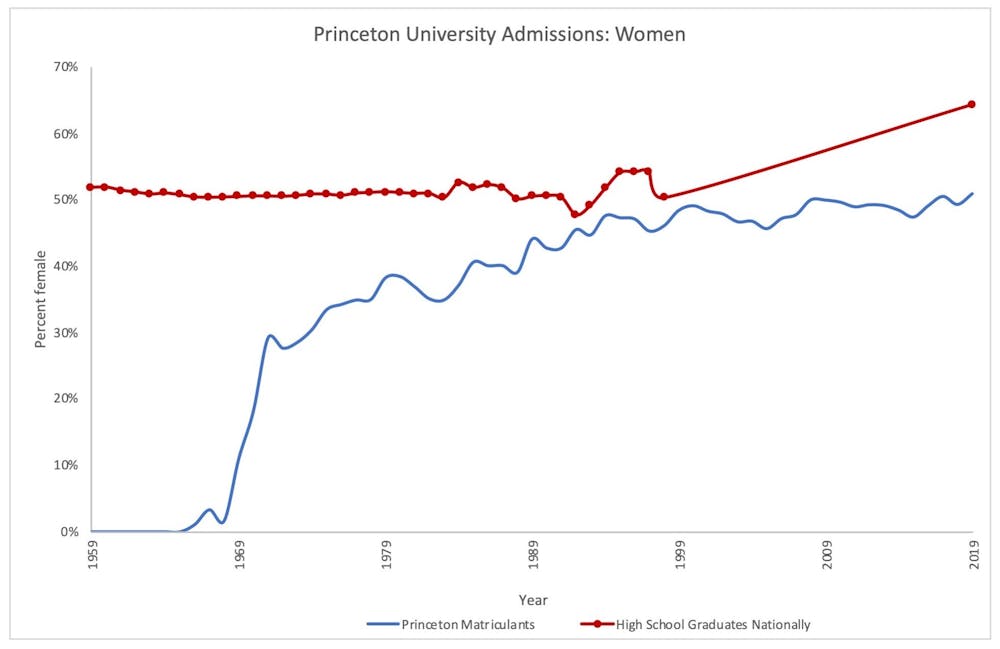
Female representation in first-year classes roughly reached parity with males by the late 1990s. Data from the late 1960s includes retroactive transfers from Princeton’s language program in 1969. (Sources: “A Princeton Profile,” Princeton Alumni Weekly, Common Data Sets, National Center for Education Statistics, Bureau of Labor, compiled admissions reports)
Liam O’Connor / The Daily Princetonian
Directing diversity
The story of Princeton admissions during the late 20th century is one of increasing diversity in the student body as selectivity tightened.
Men outnumbered women by a ratio of 2:1 in the Class of 1979, but it dropped to 3:2 by the Class of 1989 and reached parity on campus in 2004. International students rose from comprising one out of every 20 students in the Class of 1985 to one out of 10 in the Class of 2011. The number of Asian students increased seven-fold from 1971 to the turn of the century, and the number of Hispanic students doubled.
The University struggled to recruit more Black students. Admissions officers were blunter in their discussions on affirmative action — which they originally insisted would raise “the status of the negro in our free society” — in earlier decades than they are today. Director of Admission John T. Osander ’57 recounted in 1969 his responses to common questions that parents asked him:
Question: Are you favoring someone whose skin happens to be Black?
Answer: Yes, we are.
Question: Will someone who doesn’t happen to be Black lose out because you take the Black?
Answer: Yes he will.
Black students surged from comprising 1.7 percent of freshmen in 1967 to 10 percent of first-year students five years later. But they’ve stalled at around 8 percent ever since.
Indeed, the building blocks of today’s racial tensions — that flared in the 2018 Harvard affirmative action lawsuit — were already in place by the mid-1980s. Although more than a third of Black applicants were admitted in 1975 and 1985, the acceptance rate for Asian applicants dropped from 21 percent to 14 percent.
“I am also concerned about Asian Americans being admitted at the lowest rate of all minorities in spite of the fact that the academic credentials of this group are much stronger than those of the other sub-groups,” Dean of Admission Jim Wickenden ’61 wrote in 1981.
The breakdown between public and private high school graduates in an incoming class has changed little since the middle of the last century. Fifty-nine percent of the Class of 1967 attended public schools, compared to 61 percent in the Class of 2023.
“We were still seen as a university for the preppy and privileged,” said Steve LeMenager, who served as Director of Admission in the 1990s. He maintained that his office focused on outreach to public high schools and tried to rely less on traditional private feeder schools. Private school percentages, however, didn’t decrease, because private high schools had begun to recruit their own students more broadly, offering applicants who were more diverse than those in the 1960s.
A peculiar trend that did occur was that Princeton gradually took fewer students from private feeder high schools and shifted to taking more students from public feeders. The list of private schools that sent the most students to Princeton in 1984 was roughly the same as it was in 2014, consisting of Phillips Exeter Academy, Phillips Academy Andover, and the like. While 24 percent of the Class of 1989’s private school graduates attended one of the top 19* feeder private schools, only 16.7 percent of those in the Class of 2018 did the same.
The list of top public feeder schools in 1984 also looks remarkably similar — with Stuyvesant, Princeton High School, and New Trier — minus several of today’s most notorious magnet and charter schools. The top 11 public feeder schools contributed 8.7 percent of the Class of 1989’s public school graduates, and that figure rose to 9.2 percent in the Class of 2018.

The high school backgrounds of Princeton’s undergraduates has hovered around a 60/40 split between public and private schools, respectively, despite 90 percent of the nation’s high school graduates coming from public high schools. (Sources: Princeton University “Admission Statistics,” Princeton Alumni Weekly, National Center for Education Statistics, compiled admissions reports)
Liam O’Connor / The Daily Princetonian
A new century
The most recent and rapid developments have occurred in students’ socioeconomic backgrounds.
“In the last 10–15 years, the commitment to reducing debt and finding students from all walks of life is pretty clear,” said former Associate Dean of Admission Brian Walter. Sweeping changes to the financial aid policy in 1998 allowed more low and middle-income families to afford a Princeton education. Although less than half of undergraduates were on financial aid throughout the 20th century, nearly two thirds of them were by 2010.
Meanwhile, acceptance rates plummeted. Applications to Princeton doubled between 2000 and 2019. Thirty-nine percent of applicants to the Class of 1963 were admitted. Six decades later, a mere 5.8 percent of applicants got into the Class of 2023. This heightened selectivity has amazed even the admissions officers who first implemented the modern selection process.
“What used to be the 30–40 percent admissions rate is now down to 5–6 percent. That’s extraordinary. We never knew that that could actually happen,” Greene said.
While the admission rate for the overall applicant pool is a seventh of what it was 60 years ago, the legacy admission rate has little more than halved. As a result — despite only 14 percent of the Class of 2023 being children of alumni in contrast to 22 percent of the Class of 1963 — legacies’ advantage is almost three times stronger today than it was in 1959.
The University’s public reports likely aren’t telling the full story of all the trends. President Harold Shapiro GS ’64 convened a study group in 1997 to review admission policies. It included nine senior faculty members who had the opportunity to look at students’ applications as Dean of Admission Fred Hargadon walked them through his decisions.
History professor Anthony Grafton, one of the Study Group’s members, told me that he remembers discussing some of the more “problematic” aspects of admissions, such as development admits and preferences for faculty children. The report of the committee’s proceedings that was released made little mention of them. Descriptions of athletic recruitment’s role were kept very general, and details on legacy admissions were buried in a footnote.
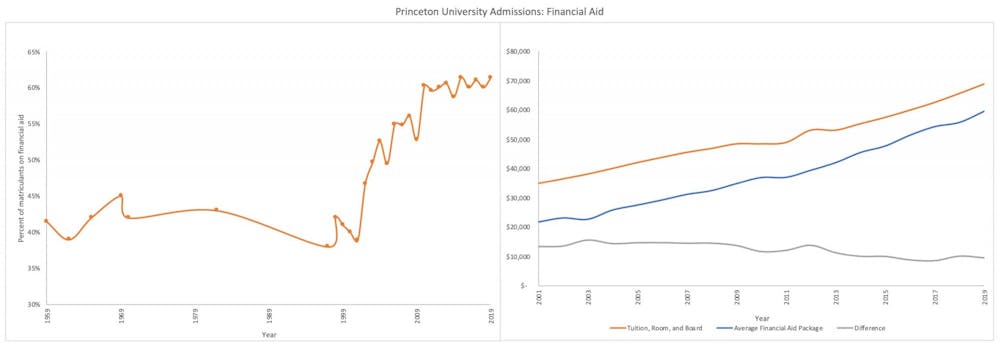
Left: The number of students on financial aid rose dramatically after Princeton introduced its new policy in 1998. Right: The size of the average financial aid package has kept pace with swelling costs in the twenty-first century. In fact, the difference between them has slightly shrunk. (Sources: Common Data Sets, Princeton Alumni Weekly)
Liam O’Connor / The Daily Princetonian
The future
While Princeton has steadily become more representative of the United States, its blue-blooded base still lingers. Harvard economist Raj Chetty’s study revealed that 44 percent of students come from families whose incomes are in the 95th percentile nationally.
Princeton’s Pell Grant statistics may not mean much either. Stanford researchers showed that two unnamed universities — which had increased their enrollment of Pell-eligible students — admitted more applicants whose families were just below the income threshold needed to qualify for Pell Grants and took fewer students from just above it. They fiddled with their numbers without making any genuine changes.
My own investigations in the fall demonstrated that the University’s American students are still predominantly from wealthy, coastal enclaves, and Ivy League athletic recruitment props up an eastern upper class.
Studies have shown that the academic achievement gap between the rich and the poor wasn’t as wide in the 1960s when the process was implemented, and it has only grown in the years since then. The current admissions process has served the University well for the past 60 years. But it appears to be reaching the limits of its ability to diversify the student body.
College Board was on the right track when it announced last year that it would introduce an “adversity score” that tried to indicate the obstacles that a student had to overcome in her school and neighborhood. The Wall Street Journal’s analysis of its plan demonstrated that such context could be useful for identifying high schoolers who achieve unusually high scores given their background. It was rolled back partly because it didn’t capture parental income and education level.
The introduction of academic and extracurricular rankings in admissions reoriented the University’s direction toward educating academic high achievers, rather than children of the aristocracy. A similar shift, which more uniformly emphasizes teaching bright students from all segments of society, needs to occur today. Crafting another ranking (or several) or normalizing academic credentials would be a way to account for the advantages and disadvantages that students face during grade school. Princeton certainly has or could start recording data from its 30,000 annual applicants that would be needed to tackle such a challenge.
In the spirit of Dunham, it’s about time for Princeton to reinvent the admissions process. Now — like then — immense demographic forces are transforming who joins the Ivy League applicant pool and who is competitive in it.
Princeton’s admissions policies have pushed the envelope for the past six decades. With some adjustment, they will continue to do so for the next six.
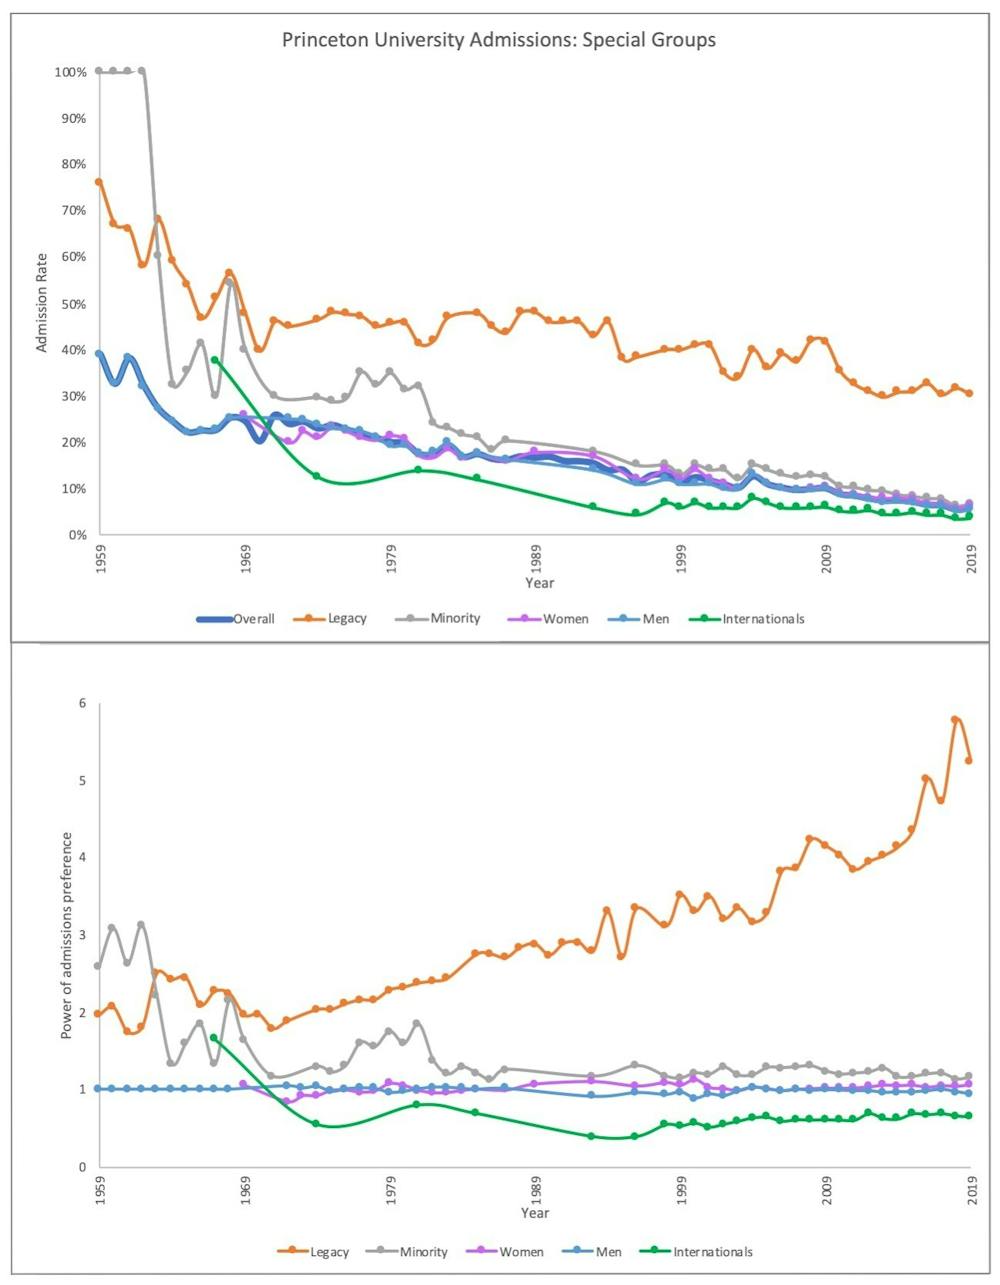
Top: Admission rates have fallen for all groups of students, but the rate for legacy applicants has declined more slowly. International students are accepted at a rate lower than that of the applicant pool overall. Bottom: Admission rates for special groups normalized to the overall applicant pool’s admission rate. A value of 1 indicates that a group’s admission rate equals that of the full applicant pool. A value of, say 2, means that it is twice as high. A value of, say 0.5, means that it is half as high. The relative power of legacies’ admission advantage skyrocketed in the 2010s. Meanwhile, the power of minorities’ admission advantage has weakened. (Sources: “A Princeton Profile,” Princeton Alumni Weekly, Common Data Sets, The Daily Princetonian, compiled admissions reports)
Liam O’Connor / The Daily Princetonian
*Specifying the top 19 private schools and the top 11 public schools may seem like arbitrary cutoffs, and they are. That’s just how they’re listed in the 1984 admissions report to the president.
This is the second article in a series about Princeton’s admissions process.
Liam O’Connor ’20, from Wyoming, Del., concentrated in geosciences. He can be reached at lpo@princeton.edu.


