Today, there are more female students, more FLI students, more students of color, and more students who identify as LGBTQ+ than there have ever been at the University. In covering this changing community, The Daily Princetonian has not kept pace.
The need to provide coverage on and for the student body motivates our efforts to recruit and support a more diverse staff. In an era when newsrooms increasingly strive to represent the communities they cover and to include voices previously excluded, the ‘Prince’ recognizes its responsibility to follow suit. Doing so especially behooves an organization dedicated to educating the next generation of journalists.
To evaluate the ‘Prince’ against the University, the Board circulated a 10-question survey to the entire staff, which is comprised of undergraduate students. Approximately two-thirds of the staff responded to the survey. By studying the results, we have identified where the ‘Prince’ lags behind, and we have developed plans to rectify these shortcomings. In addition, we welcome suggestions from our readers.
From observation, we know that our editors are less diverse than the larger staff. This is deeply concerning. Although our leadership should be representative of our staff, it is not. A group of almost exclusively white and East Asian students currently decides what gets published. To ensure that such decisions are accountable to our readers, representation is critical.
Below we have offered a set of solutions that attempts to address both this particular inadequacy and the larger problems we have identified.
Solutions
The ‘Prince’ intends to establish internal liaison positions, drawing from a range of campus organizations. This spring, we will offer the members of our staff in such organizations the opportunity to serve as the paper’s liaison with Sexual Harassment/Assault Advising, Resources, and Education (SHARE); the AccessAbility Center; the LGBT Center; the Women*s Center; and the Carl A. Fields Center. Such liaison positions coincide with our broader initiative to reach out — through a variety of means — to students from all walks of life and campus experiences.
Contributing to the ‘Prince’ or serving on the Managing Board requires significant investments of time and energy. In some cases, serving as a ‘Prince’ staffer or editor requires students to sacrifice other commitments, particularly jobs that may provide critical income for their families or financial aid packages. Furthermore, we recognize that members of our staff have varying financial needs. With the support of our Board of Trustees, the 142nd Managing Board is examining how to assist these members. The 143rd Board, which begins next month, will continue this work.
For students from disadvantaged backgrounds, journalism has a high barrier to entry. The industry has traditionally required journalists to know the particular style and lexicon of reporting. Although we train all of our staff, we plan to pay special attention to staffers who have never formally interacted with journalism. We will recruit as widely as possible. We will strive especially to recruit from historically underrepresented groups in newsrooms. By offering one-on-one mentorship with our staff and workshops with professionals, we believe we can introduce the field to a range of student journalists.
Finally, we acknowledge that we will only accomplish our goals if the paper’s uppermost leadership reflects the community we cover. Many students of color and students from disadvantaged backgrounds contribute to the ‘Prince,’ but fewer go on to serve as editors. Through mentorship and training for all students, we hope to diversify every level of the Managing Board.
With these goals in mind, we discuss our findings below.
Results

The survey was open between Sunday, Nov. 18, and Sunday, Nov. 25, 2018, and received 100 responses, or approximately two-thirds of our staff. We consider this number to be representative. Each question received between 97 and 100 answers.
Gender. Sixty-nine percent of respondents identified as female. The rest identified as male. None identified as trans, non-binary, or other. In contrast, the University reports that, for this 2018–19 academic year, the undergraduate population is 49 percent female and 51 percent male. The University does not make available the number of trans, nonbinary, or other gender non-conforming students.
Sexual orientation. Seventy-eight percent of respondents identified as straight, and 12.5 percent identified as bisexual. The remaining 9.4 percent selected gay or lesbian, asexual, or queer, with none indicating other. The University does not report statistics on sexual orientation, but an estimated 95 percent of U.S. adults are straight (4.5 percent identified as LGBT in 2017).
Disability. In response to “Do you have a disability and/or are you handicapped?”, 6.1 percent answered “yes.” According to the U.S. Census Bureau, 5.3 percent of the population ages 15 to 24 lived with a severe disability in 2010. The prevalence of any disability in this age cohort was 10.2 percent.
U.S. citizenship. Of the respondents, 8.2 percent indicated that they were not U.S. citizens. According to the Davis International Center, in the 2017–18 academic year, 11.7 percent of undergraduates were international students, defined as “anyone who is not a U.S. Citizen or U.S. Permanent Resident.”
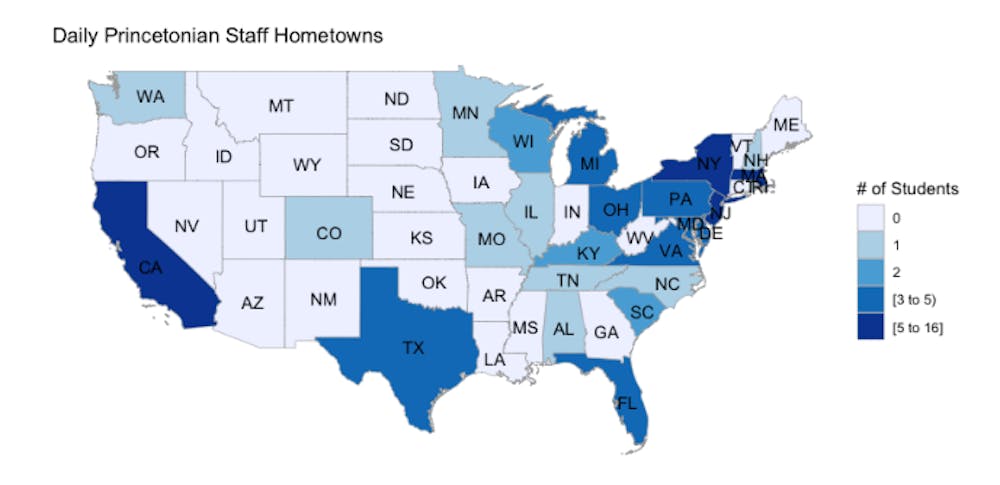
Zip codes. There were no respondents from Alaska or Hawaii, so the map below represents the continental United States. Among respondents, all but one of the 92 percent who are U.S. citizens indicated their zip code.

Map by Emily Erdos, head opinion editor
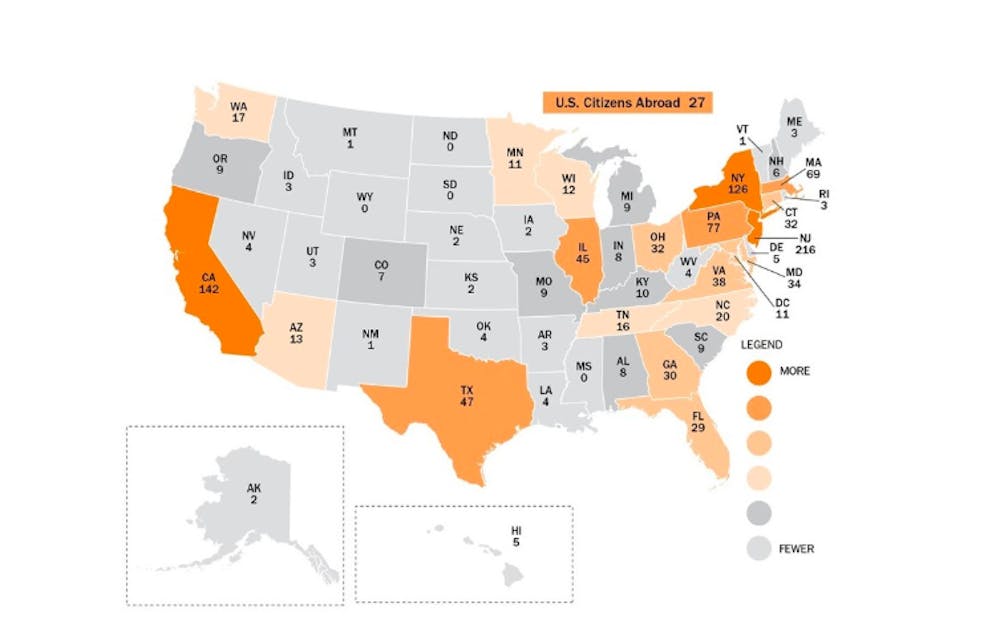
Similarly, members of the Class of 2022 hail from the states illustrated in the map below. Many students come from New York and California, and more students hail from the East Coast than the West. The fewest come from the Plains states.

Courtesy of the Princeton University Undergraduate Admission Office
Ethnicity. Of the respondents, 10 percent identified as Hispanic or Latino, while the remainder identified as “other” or “none of the above.” By comparison, 11 percent of the undergraduate student population identifies as Hispanic this 2018–19 academic year.
Race. Nearly 48 percent of respondents considered themselves to be nonwhite. Among total respondents, 28 percent identified as “Asian or Asian American,” 14.3 percent as “Black or African American,” 4.1 percent as “other,” and 1.0 percent as “American Indian or Alaska Native.” No respondents identified as “Native Hawaiian or other Pacific Islander” or “other indigenous.” We chose these distinctions to correspond to the categories used by the U.S. Census. In comparison, the University’s undergraduate population is 45 percent white, 25 percent Asian, and 9 percent black, according to Many Voices, One Future — the University’s resource for diversity and inclusion.
Religion. Of our respondents, 60 percent identified with an organized religion, such as Christianity, including Protestantism, Judaism, Islam, Hinduism, or other. The remainder were atheist or agnostic. No respondents selected Catholicism, Native American, or inter/nondenominational. According to the Pew Research Center, 46 percent of the United States is Protestant. Including other denominations, that number of Christians rises to 71 percent. In the United States, 21 percent of respondents are Catholic, compared to 0 percent of our respondents; 2 percent are Jewish, compared to 19 percent of our respondents; and 1 percent each are Muslim and Hindu. In the United States, 23 percent of the population is religiously unaffiliated, compared to 39 percent of ‘Prince’ respondents. The nation’s population, however, is on average much older than the University’s undergraduate student body.
Guardian education level. All respondents answered a question about the highest level of education or highest degree that any parent or guardian attained. Of these, 76 percent answered graduate degree, and 9 percent answered bachelor’s degree. The remaining 14 percent indicated their parents or guardians did not have a college degree, including 3 percent of respondents reporting their parents or guardians have less than a high school diploma. None answered associate’s degree. Similar to our statistic, 17 percent of the Class of 2021 is first-generation college students.
Income. Lastly, all respondents answered a question about 2017 household income before taxes. Of our respondents, 28 percent indicated that their household income was more than $250,000, 30 percent indicated an income between $100,000 and $250,000, and 15 percent responded “I don’t know.”
According to the Office of Undergraduate Admission, all families with incomes less than or equal to $180,000 per year in the Class of 2021 qualified for financial aid, and about 60 percent of undergraduates receive financial aid. That being said, the vast majority of those with family incomes between $180,000 and $250,000 received financial aid packages, and so the 40 percent of families who did not receive financial aid mostly comprised families making more than $250,000. By comparison, 39 percent of ‘Prince’ staffers who responded to the poll had incomes of $150,000 or less.
Methods
A survey was emailed twice to the listserv of the full ‘Prince’ staff. The survey questions collected information about gender, sexual orientation, disability, zip code, U.S. citizenship, ethnicity, race, religion, guardian education level, and household income. Neither the survey nor any individual question was mandatory. Responses were disaggregated and anonymized.
Board chairs
Marcia Brown ’19
Emily Erdos ’19
Board members
Samuel Aftel ’20
Isabel Hsu ’19
Jon Ort ’21
Samuel Parsons ’19
Sebastian Quiroz ’20
Cy Watsky ’21
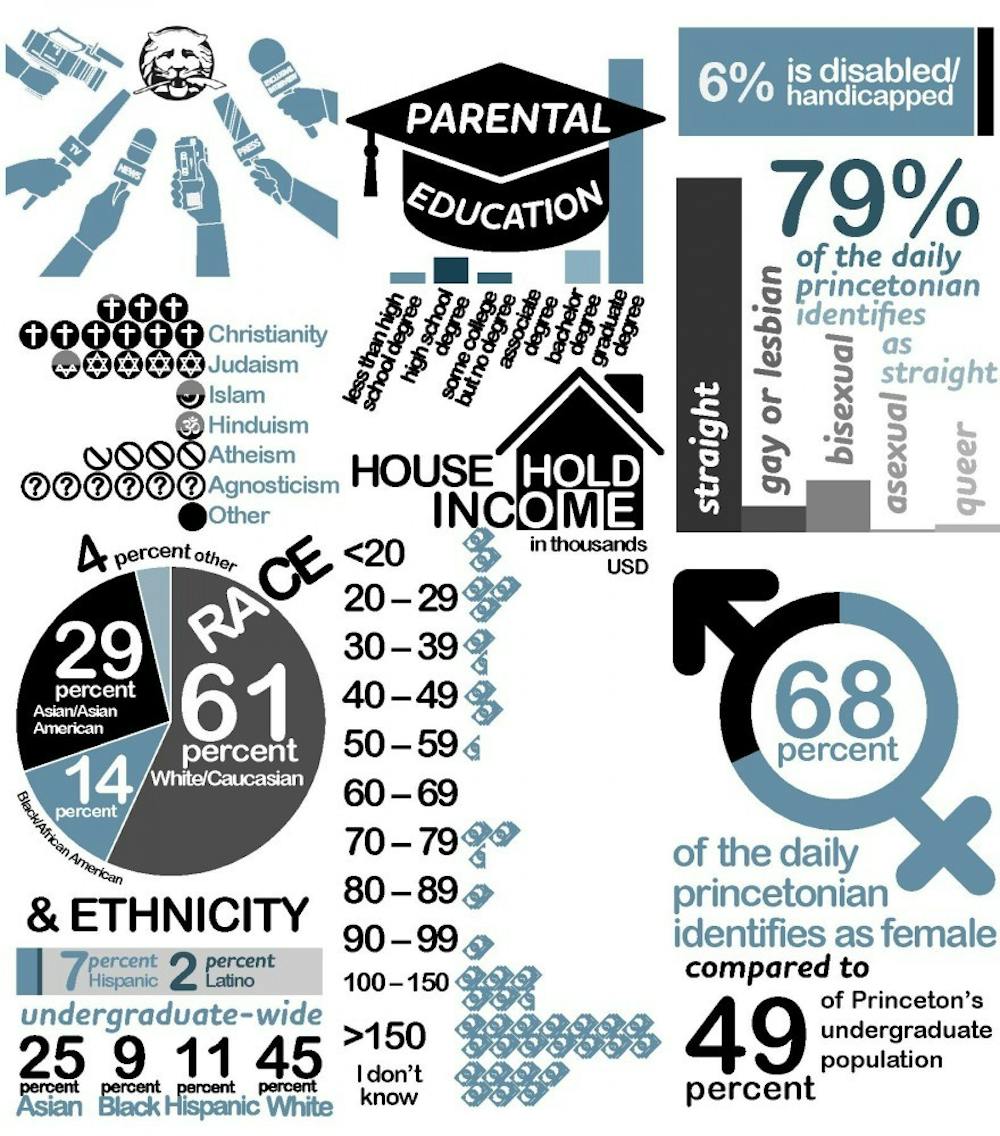
Below is a written version of the infographic. Specific statistics regarding gender, ethnicity, race, disability, citizenship, zip codes, religion, and guardian education level may be found above, and are not copied below.
Annual income distribution among ‘Prince’ staffers:
Less than $20,000: 4.0 percent
Between $20,000 and $29,999: 6.1 percent
Between $30,000 and $39,999: 3.0 percent
Between $40,000 and $49,999: 4.0 percent
Between $50,000 and $59,999: 1.0 percent
Between $60,000 and $69,999: 0.0 percent
Between $70,000 and $79,999: 4.0 percent
Between $80,000 and $89,999: 2.0 percent
Between $90,000 and $99,999: 2.0 percent
Between $100,000 and $150,000: 13.1 percent
Between $150,000 and $250,000: 17.2 percent
More than $250,000: 28.3 percent
I don’t know: 15.2 percent
Sexual orientation among ‘Prince’ staffers:
Straight: 78.35 percent
Gay or Lesbian: 6.19 percent
Bisexual: 12.37 percent
Asexual: 1.03 percent
Queer: 2.06 percent
Other (please specify): 0.0 percent
Religious Identity among ‘Prince’ staffers:
Protestantism: 6.19 percent
Catholicism: 0.00 percent
Christianity: 28.87 percent
Judaism: 18.56 percent
Islam: 1.03 percent
Buddhism: 0.00 percent
Hinduism: 1.03 percent
Native American: 0.00 percent
Inter/ Non-denominational: 0.00 percent
Atheist: 15.46 percent
Agnostic: 24.74 percent
Other (please specify): 4.12 percent


